Note: this feature is in preview. Names, images, and steps may change going forward.
Enable the Agent on the VM
Click Monitor from the left panel
![]()
Click Data Collection rules in the menu
![]()
Click Create  to create a rule for Windows or Linux
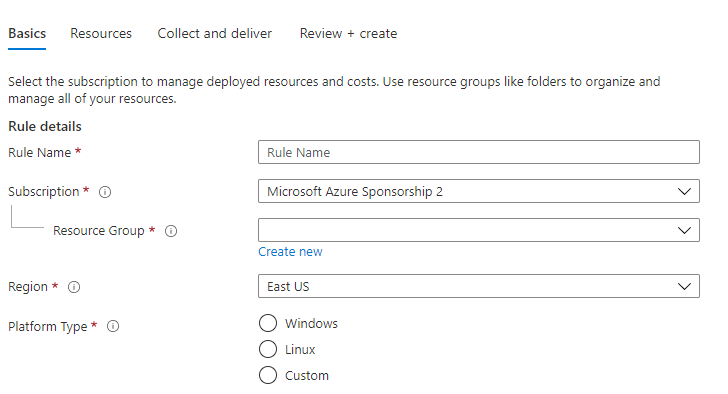
Name the rule and choose a resource group, a recommendation would be to include Windows or Linux in the name. In the past examples we have used “Alerts” resource group. Choose Windows or Linux
Click Next
On the Resources Tab, add the virtual machines to be monitored by hitting the Add resources button ![]()
On the resource types at the top you can filter to just Virtual Machines.
Expand the resource groups to show the virtual machines and hit the check boxes next to each VM.
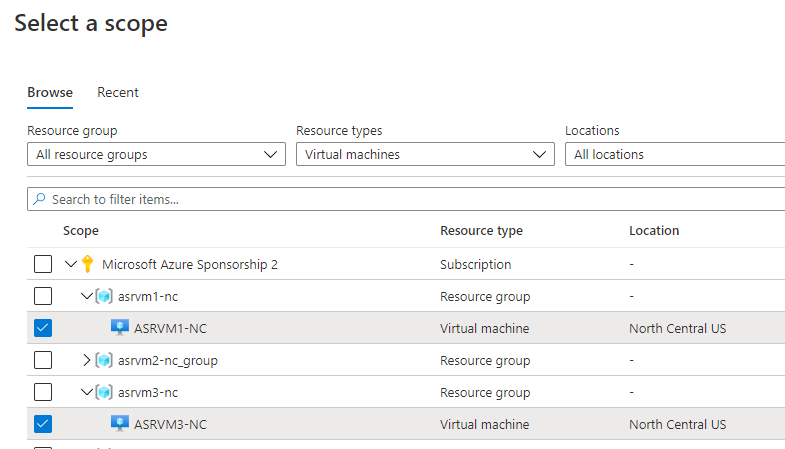
Once this is completed this process will deploy the extension to the VM’s selected.
Click Next: Collect and deliver>
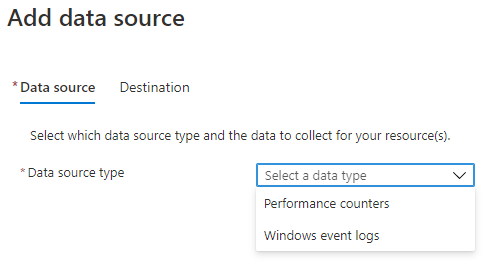
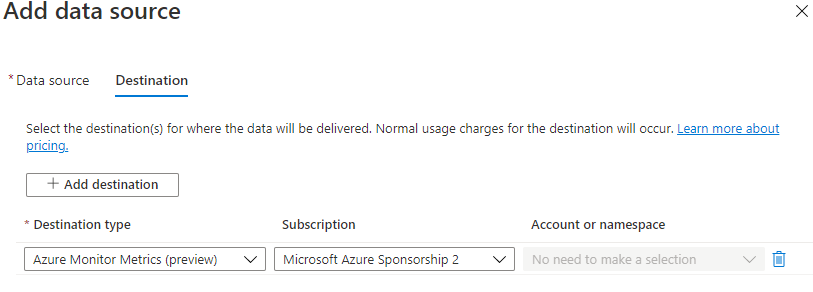
On the Collect and deliver tab click the Add data source button.
![]()
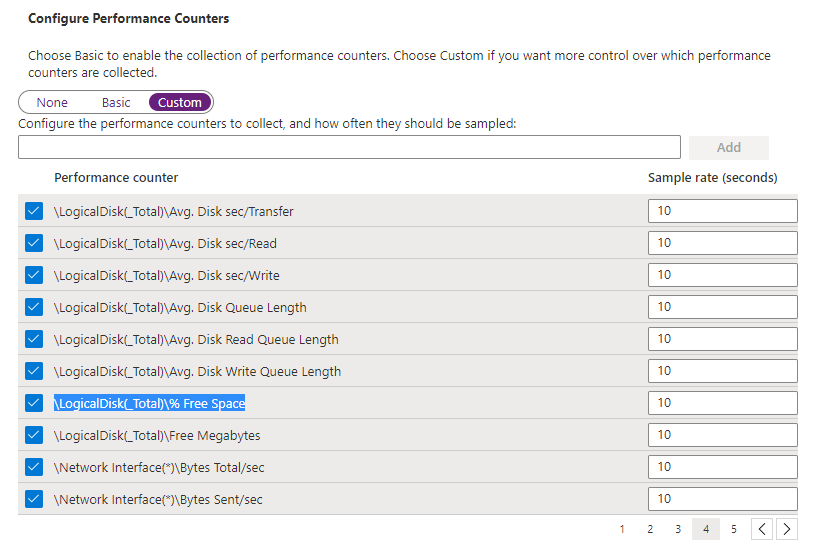
From the drop down choose Performance counters. If you choose custom it will display all the counters collected. On page 4 it shows the Logical Disk(_Total)\%Free Space counter.
Click Next: Destination>
Click Add data source
![]()
Click Next: Review + create> to validate the rule. Once Validated click the Create button.
Go to Virtual Machines ![]() to verify the extension was deployed.
to verify the extension was deployed.
In the Settings group of the Virtual machine click Extensions to verify Azure Monitor Windows or Linux Agent was installed
![]()
![]()
Enabling Monitoring on the Virtual Machines
Click Monitor and then Virtual Machines to enable the monitoring of the VM. Click the Not monitored tab to see the VM’s that are available to be enabled.
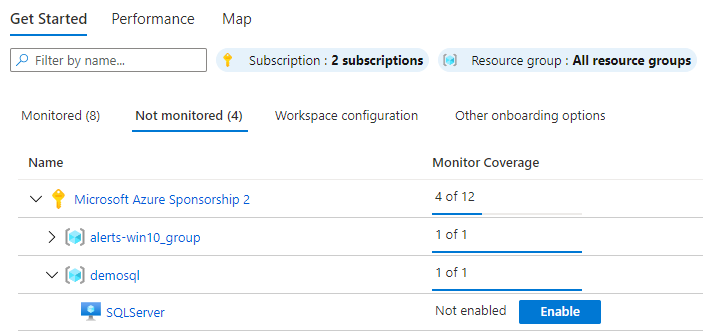
Click the enable button, and the enable button again.
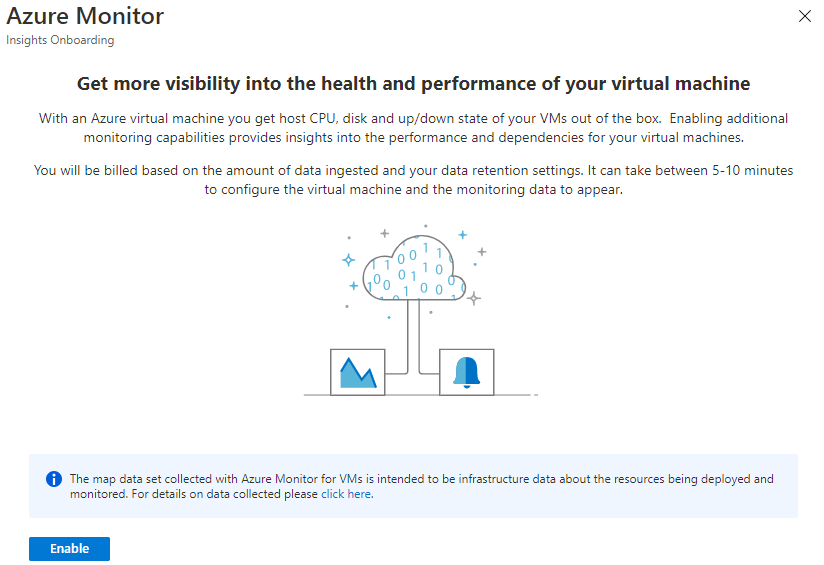
If the VM is not connected to a workspace, it will default to the one in the region. Hit the enable button to continue.
Wait 5-10 minutes.
After this time the VM should show up under the Monitored tab, and not the Not Monitored area.
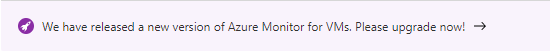
The VM will show to it needs to be upgrade.
![]()
Click on the VM and then click the purple bar at the top.
After the upgrade shows it is deployed this still may take more time to become ready.
You may see this continue to show upgrade as it may need to be more than one time. For example on the Performance tab it may show upgrade is available.
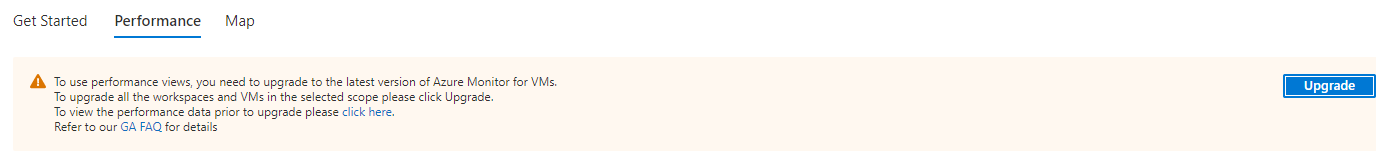
Wait a few minutes after each upgrade to ensure it is completely installed.
Once the upgrade is completed click the VM name to show that it is healthy.

Creating the Azure Monitor Alert
From Monitor click Virtual machines and then click on the Monitored tab to see the VM’s that are available to be configured for alerts. Click on the VM name to configure.

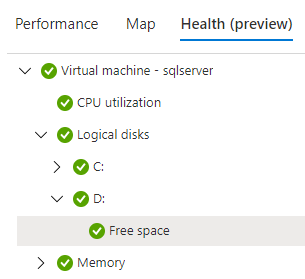
Click Health Preview and drill into the drive that you want to monitor.
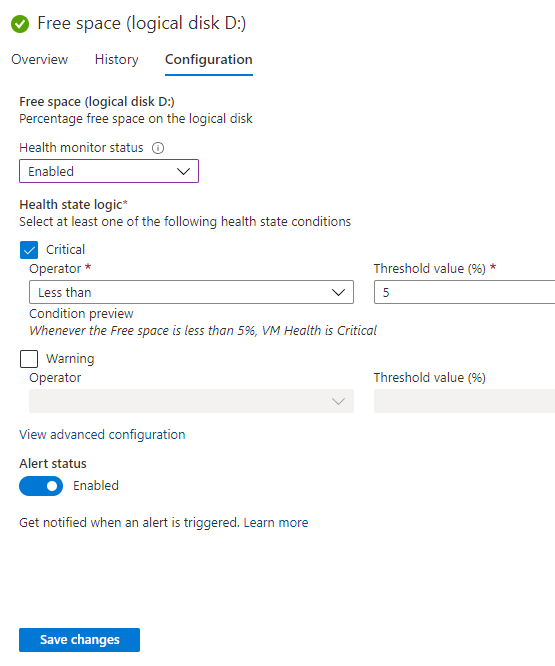
Click the Configuration tab.
Determine states to be monitored for critical and warning levels.
Choose the Operator and Threshold value to monitor. Click the slider bar to enable the alert and hit Save changes.
Create the Action Group
Now Setup the action group that will receive the alerts.
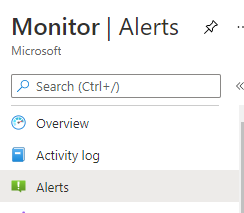
Go to Monitor then Alerts
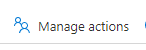
Click Manage Actions at the top
Go to the Action Rules that is in preview.
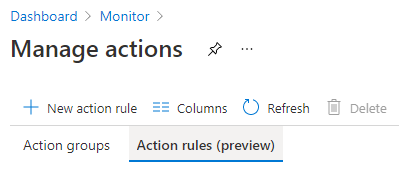
Create a new Action Rule by clicking + New Action rule.
Select the scope (subscription)

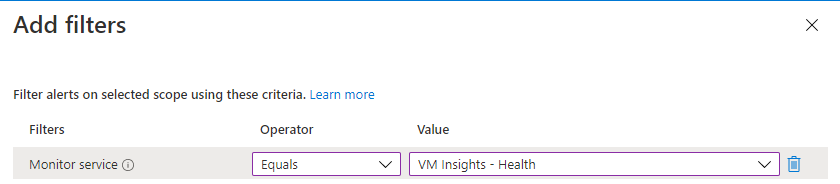
Then add a filter for this rule. Add “Monitor service” equals “VM Insights – Health”
Click Done.
Select your pre-existing Action group.

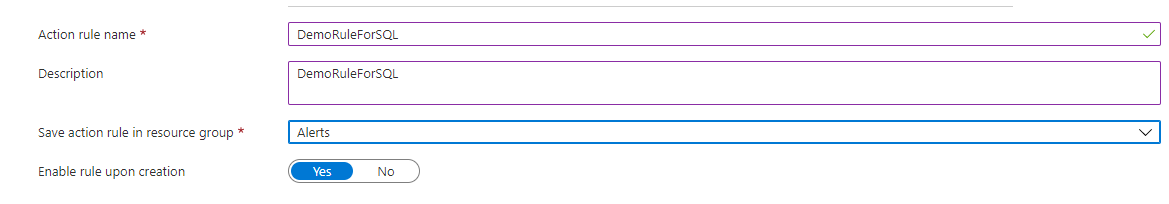
Name the rule (no spaces), and select the resource group for the rule. “Alerts” was used in the past.
Click Create.
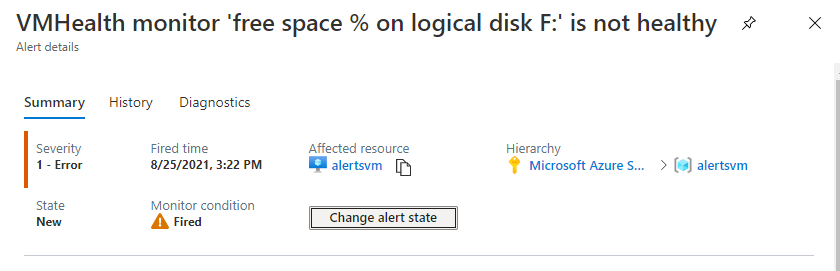
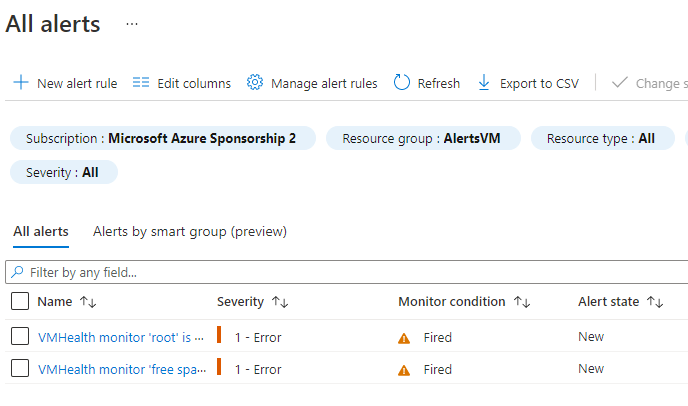
Viewing Alerts
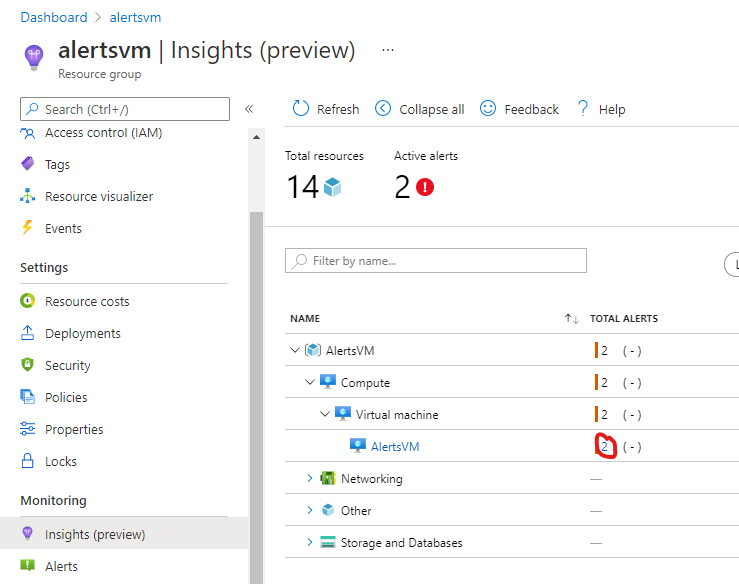
The alerts are viewed from the resource group of the VM’s that are being monitored.
![]()
Find the resource group of the VM.
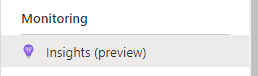
Then click on Insights (preview)
Then click the number of alerts, the example below is 2. Circled in Red.
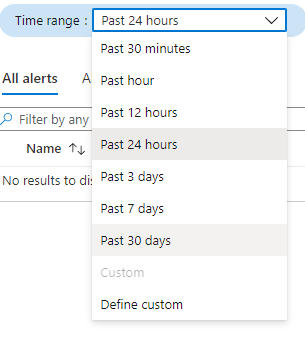
Clicking the hyperlink under the number will take you to the alerts that were fired for that VM. If no alerts are showing on the VM check the Time range.
Which will then take you to where you can change the alert state.